
Value Drill-Down
Highly aggregated results are usually like a black box: one doesn't really know what is inside or - in terms of the value - what values contributed to that specific result.
With SERAM you can perform a multiple-step drill-down analysis of any computed value. The drill-down will always go one computation deeper and show all the values which have contributed to the result or sub-result. Along with the tabular breakdown, SERAM also automatically renders charts to visualize the data, picking a meaningful chart type for the specific breakdown.
Here's an example of drilling down into a Team Members value from the Data Grid: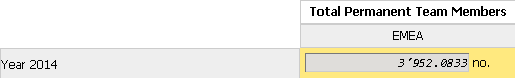
The first drill-down dissects the calculation into its parts: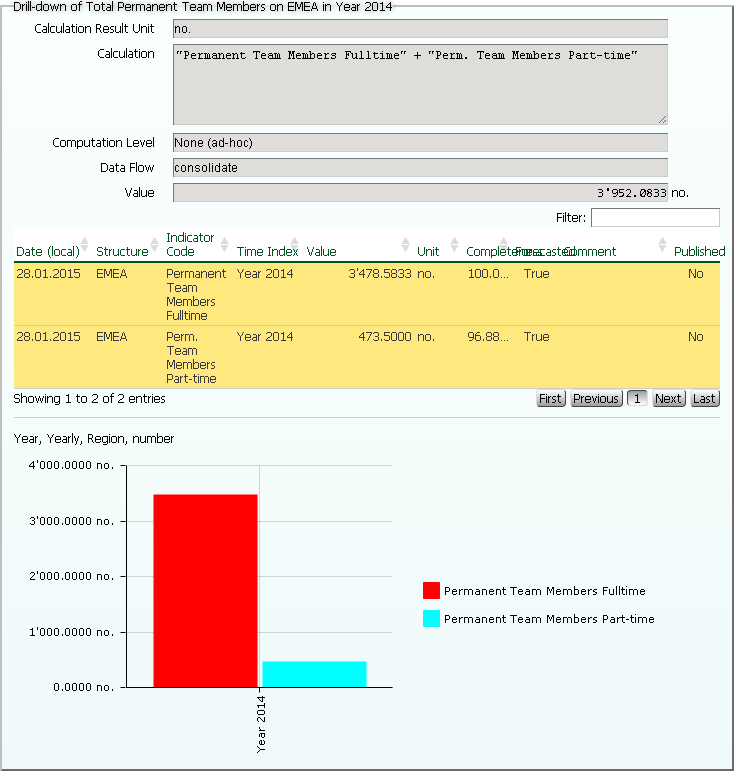
By selecting a row or clicking a bar of the graph, you can select one of the contributing values of the calculation and again perform a drill-down on the EMEA structure to see the contributing child structures: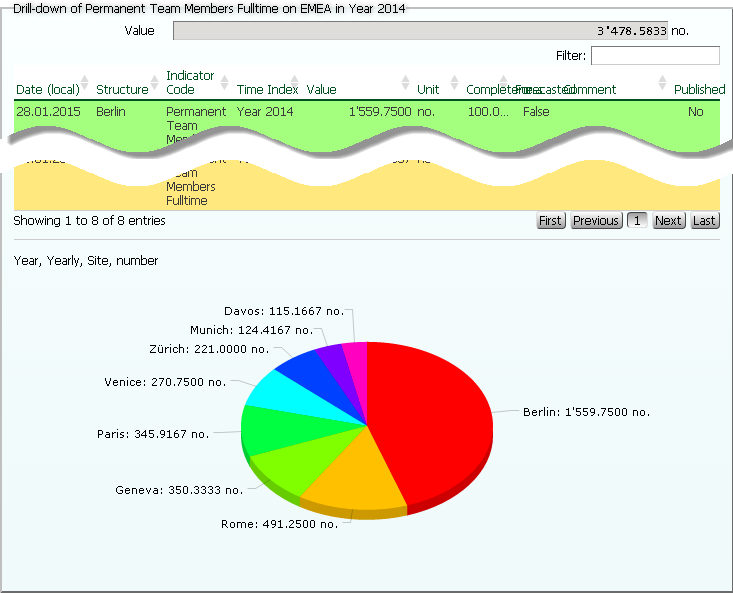
Again, one of the rows or pie slices can be clicked to select one structure and perform another drill-down, this time on the time axis since these are leaf structures: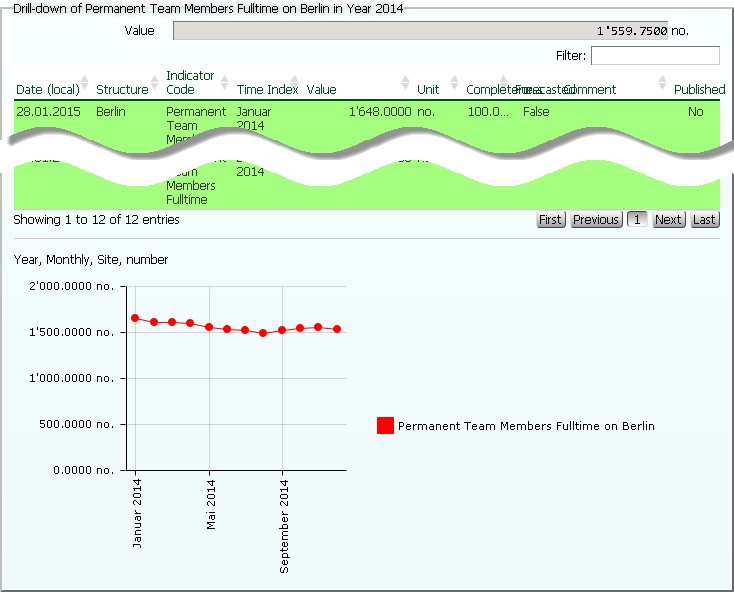
Here each month contributing to the year is now visible, and for each of these input values the history can be shown from within the drill-down interface.
Feature Categories:
- Verifying or Analyzing Data